Multiple Choice
Figure 3-8 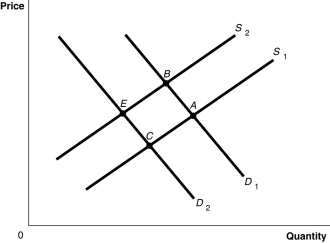
-Refer to Figure 3-8.The graph in this figure illustrates an initial competitive equilibrium in the market for apples at the intersection of D1 and S2 (point B) ) Which of the following changes would cause the equilibrium to change to point C?
A) A positive change in the technology used to produce apples and decrease in the price of oranges, a substitute for apples.
B) An increase in the wages of apple workers and an increase in the price of oranges, a substitute for apples.
C) An increase in the number of apple producers and a decrease in the number of apple trees as a result of disease.
D) A decrease in the wages of apple workers and an increase in the price of oranges, a substitute for apples.
Correct Answer:

Verified
Correct Answer:
Verified
Q28: If the price of peaches, a substitute
Q51: What is the difference between an "increase
Q57: If a firm expects that the price
Q101: Which of the following would cause an
Q153: The income effect of a price change
Q163: If the price of a product is
Q171: Market equilibrium occurs where supply equals demand.
Q181: Suppose a negative technological change in the
Q195: Figure 3-2 <img src="https://d2lvgg3v3hfg70.cloudfront.net/TB7397/.jpg" alt="Figure 3-2
Q198: A decrease in the price of GPS