Multiple Choice
Figure 13-4 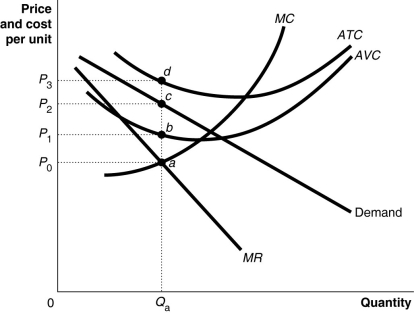 Figure 13-4 shows short-run cost and demand curves for a monopolistically competitive firm in the market for designer watches.
-Refer to Figure 13-4. What is the area that represents the total fixed cost of production?
A) 0P1aQa
B) P0adP3
C) P1bdP3
D) That information cannot be determined from the graph.
Correct Answer:

Verified
Correct Answer:
Verified
Q20: Which of the following is true for
Q28: Figure 13-9<br> <img src="https://d2lvgg3v3hfg70.cloudfront.net/TB4193/.jpg" alt="Figure 13-9
Q58: Figure 13-3<br> <img src="https://d2lvgg3v3hfg70.cloudfront.net/TB4193/.jpg" alt="Figure 13-3
Q71: Which of the following can a firm
Q97: A monopolistically competitive firm should lower its
Q119: If a firm has excess capacity, then<br>A)the
Q165: What is meant by "excess capacity"? How
Q168: If buyers of a monopolistically competitive product
Q199: When a monopolistically competitive firm breaks even
Q233: All of the following characteristics are common