Multiple Choice
Figure 13-11 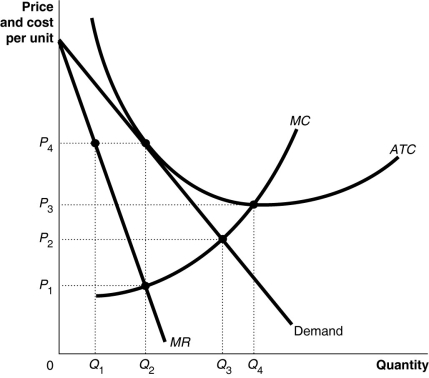
-Refer to Figure 13-11. What is the allocatively efficient output for the firm represented in the diagram?
A) Q1 units
B) Q2 units
C) Q3 units
D) Q4 units
Correct Answer:

Verified
Correct Answer:
Verified
Q6: A monopolistically competitive firm that is earning
Q6: The table below shows the demand and
Q8: Figure 13-5 <img src="https://d2lvgg3v3hfg70.cloudfront.net/TB7397/.jpg" alt="Figure 13-5
Q55: Most economists believe that consumers would be
Q73: A firm cannot control all of the
Q98: For productive efficiency to hold,<br>A)price must equal
Q117: A monopolistically competitive firm maximizes profit where<br>A)price
Q185: A profit-maximizing monopolistically competitive firm produces and
Q221: Figure 13-6<br> <img src="https://d2lvgg3v3hfg70.cloudfront.net/TB4193/.jpg" alt="Figure 13-6
Q255: If the marginal revenue is negative then