Multiple Choice
Figure 13-14 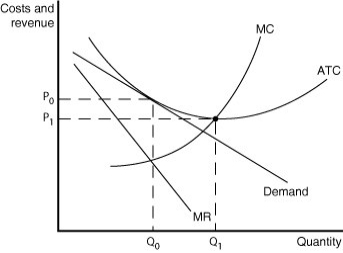 Figure 13-14 illustrates a monopolistically competitive firm.
-Refer to Figure 13-14.Which of the following statements describes the firm depicted in the diagram?
A) The firm is making no economic profit and will exit the industry.
B) The firm is suffering an economic loss by producing at Q0 but will break even it increases its output to Q1.
C) The firm achieves productive efficiency by producing at Q0.
D) The firm is in long-run equilibrium and is breaking even.
Correct Answer:

Verified
Correct Answer:
Verified
Q1: In a monopolistically competitive market, a successful
Q10: Figure 13-11 <img src="https://d2lvgg3v3hfg70.cloudfront.net/TB7397/.jpg" alt="Figure 13-11
Q47: Monopolistically competitive firms have downward-sloping demand curves.In
Q52: Figure 13-17 <img src="https://d2lvgg3v3hfg70.cloudfront.net/TB7397/.jpg" alt="Figure 13-17
Q159: Advertising is the action of a firm
Q169: Figure 13-16<br> <img src="https://d2lvgg3v3hfg70.cloudfront.net/TB4193/.jpg" alt="Figure 13-16
Q186: A monopolistically competitive firm can convince buyers
Q186: Starbucks started out small in 1971, but
Q196: The entry and exit of firms in
Q250: Figure 13-11<br> <img src="https://d2lvgg3v3hfg70.cloudfront.net/TB4193/.jpg" alt="Figure 13-11