Multiple Choice
Correct. In the given graph, a shift from D1 to D0 indicates a decrease in the demand for the good. See 3-2: DemandFigure 3-1 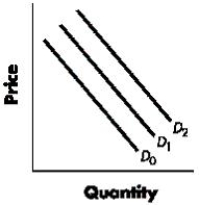
A) increase in demand.
B) increase in demand
C) increase in quantity demanded.
D) decrease in quantity demanded.
E) decrease in the price of the good.
Correct Answer:

Verified
Correct Answer:
Verified
Related Questions
Q35: If the price of Good A increases
Q36: Figure 3-4 represents the market for butter.
Q37: If roses are currently selling for $30
Q38: Which of the following is true of
Q39: An increase in the price of a
Q41: When there is an excess quantity supplied
Q42: Beach resorts raise their prices during the
Q43: Incorrect. The quantity supplied of a good
Q44: When quantity demanded decreases at every possible
Q45: How are sales and long lines prior