Multiple Choice
Figure 3-2 shows the shifts in the demand curve for a good. A change from Point A to Point E represents a(n) :Figure 3-2 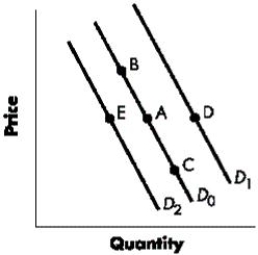
A) increase in demand.
B) decrease in demand
C) decrease in quantity demanded
D) increase in quantity demanded
E) increase in the price of the good.
Correct Answer:

Verified
Correct Answer:
Verified
Related Questions
Q30: Price reductions will usually result whenever the
Q49: In markets, prices move toward equilibrium because
Q49: As the price of DVD players has
Q50: Ceteris paribus, when a demand curve shifts,
Q52: In economics, the demand for a good
Q53: If the electronics market is experiencing a
Q55: When the price of steak falls, we
Q56: The market supply schedule reflects the total
Q58: In the three months before a $1
Q58: The supply curve for a good will