Multiple Choice
Graph A below shows an elastic demand curve, and Graph B shows an inelastic demand curve. With reference to Graph A, at a price of $20, total revenue equals _____.Figure 4.1: 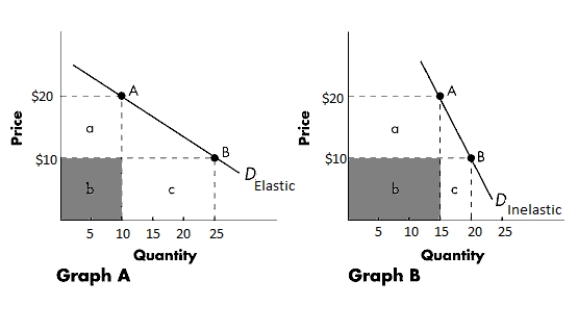
A) $400
B) $200
C) $500
D) $1,000
E) $100
Correct Answer:

Verified
Correct Answer:
Verified
Related Questions
Q11: If James is willing to sell an
Q12: The demand for a good is said
Q13: A steel mill raises the price of
Q14: If the supply curve of a good
Q17: The long-run demand curve for air travel
Q18: Which of the following is an example
Q19: If the elasticity of supply coefficient equals
Q21: In an attempt to reduce poaching of
Q58: The main purpose of government price controls
Q158: A price floor set above the equilibrium