Multiple Choice
Graph A below shows an elastic demand curve, and Graph B shows an inelastic demand curve. With reference to Graph B, at a price of $20, total revenue equals _____.Figure 4.1: 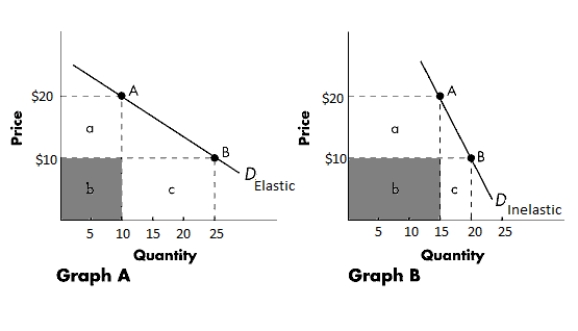
A) $200
B) $300
C) $250
D) $150
E) $100
Correct Answer:

Verified
Correct Answer:
Verified
Related Questions
Q18: Which of the following is an example
Q19: If the elasticity of supply coefficient equals
Q21: In an attempt to reduce poaching of
Q22: If the demand for a good is
Q24: Which of the following is not a
Q25: In a recent fare war, America West
Q26: Suppose a 25 percent decrease in the
Q27: The price elasticity of demand for a
Q28: Prices have soared for parking facilities in
Q158: A price floor set above the equilibrium