Essay
The following graph shows the demand and supply curves of a good. Identify the areas of consumer and producer surplus when the market price equals $20.Figure 4.2: 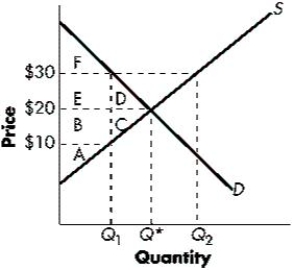
Correct Answer:

Verified
Answers will vary. Consumer surplus equa...View Answer
Unlock this answer now
Get Access to more Verified Answers free of charge
Correct Answer:
Verified
Answers will vary. Consumer surplus equa...
View Answer
Unlock this answer now
Get Access to more Verified Answers free of charge
Related Questions
Q44: If recent sharp increases in the price
Q45: A subsidy to wheat farmers decreases the
Q46: The tax burden for a good falls
Q47: When the local symphony recently raised the
Q48: The price elasticity of demand for gourmet
Q50: When a 9 percent increase in price
Q51: A rent ceiling set below the equilibrium
Q52: If a price floor imposes a binding
Q53: The following table shows Tim's demand for
Q54: The Book Nook reduces prices by 20