Multiple Choice
The figure below shows the total adult population and the number of employed and unemployed civilians in the economy. Based on the figure, the unemployment rate is approximately _____.Figure 11-1 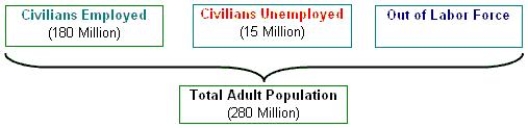
A) 4.5
B) 7.7
C) 9.2
D) 5.4
E) 8.3
Correct Answer:

Verified
Correct Answer:
Verified
Related Questions
Q36: Which of the following measures the average
Q37: A major macroeconomic goal of nearly every
Q38: A discouraged worker is:<br>A)one who opts to
Q39: The unemployment rate may underestimate the true
Q40: Which of the following groups would not
Q42: Which of the following statements is incorrect?<br>A)Job
Q44: Which of the following people is most
Q45: Unemployment rises and falls in the same
Q45: When unemployment rises above the natural rate,
Q80: What are the four phases of the