Multiple Choice
The table below shows the prices of three consumer goods in three years, respectively: 2010, 2011, and 2012. 2010 is assumed to be the base year. Based on the table, the price index in 2012 is _____.Table 11-1 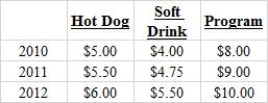
A) 79.1
B) 88.3
C) 113.2
D) 126.5
E) 300
Correct Answer:

Verified
Correct Answer:
Verified
Related Questions
Q17: The natural rate of unemployment can change
Q42: Which of the following statements is incorrect?<br>A)Job
Q44: Which of the following people is most
Q45: When unemployment rises above the natural rate,
Q45: Unemployment rises and falls in the same
Q49: If the number of employed persons in
Q50: The inflation rate rose from 3 percent
Q51: Economists believe that the Consumer Price Index
Q52: New inventions may displace some workers, resulting
Q80: What are the four phases of the