Multiple Choice
Figure 13-3 shows the relationship between real GDP and the price level in an economy. In the figure, _____ represents short-run aggregate supply?Figure 13-3 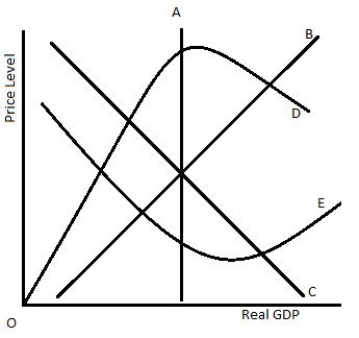
A) curve A
B) curve B
C) curve C
D) curve D
E) curve E
Correct Answer:

Verified
Correct Answer:
Verified
Related Questions
Q21: What is the natural level of output?
Q70: The interest rate effect suggests that the
Q71: In the short run, an increase in
Q74: Holding all other things constant, when the
Q75: Which of the following is a difference
Q76: Sam prefers holding his savings as cash
Q77: When there is a recessionary gap, one
Q78: Which of the following would lead to
Q86: The long-run aggregate supply curve is the
Q102: Explain why the short-run supply curve is