Multiple Choice
Figure 13-3 shows the relationship between real GDP and the price level in an economy. In the figure, _____ represents long-run aggregate supply?Figure 13-3 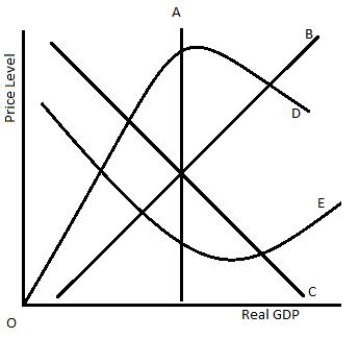
A) curve A
B) curve B
C) curve C
D) curve D
E) curve E
Correct Answer:

Verified
Correct Answer:
Verified
Related Questions
Q24: Explain how changes in the stock of
Q25: When the price level rises as a
Q78: Describe the difference between a microeconomic demand
Q88: The aggregate demand curve portrays the relationship
Q90: In the long run, the real output
Q91: If there was no profit effect, but
Q92: Figure 13-8 shows the short-run macroeconomic equilibrium
Q93: Figure 13-4 shows the short-run macroeconomic equilibrium
Q94: Investment will increase if:<br>A)business taxes and real
Q124: If the overall price level decreases, then