Multiple Choice
The figure below shows the aggregate demand curve, the long-run aggregate supply curve, and the short-run aggregate supply curve in an economy. Based on the figure, if an increase in aggregate demand from AD0 to AD1 is fully anticipated, the economy will move from point A to point _____ in the short run.Figure-1 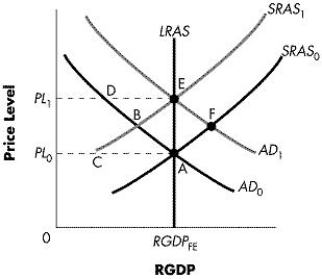
A) B
B) C
C) D
D) E
E) F
Correct Answer:

Verified
Correct Answer:
Verified
Q16: Monetary policy is more effective at closing
Q17: Which of the following was believed to
Q18: The crowding-out effect:<br>A)increases interest rates and decreases
Q19: The financial crisis of 2008-2009 led to
Q20: Which of the following would cause the
Q22: Which of the following is true?<br>A)The recession
Q23: From early 2007 to mid-2008, the short-run
Q24: If commercial banks increase their borrowing from
Q25: The time required to identify an appropriate
Q26: Critics of the rational expectations theory believe