Multiple Choice
The figure below shows the aggregate demand curve, the long-run aggregate supply curve, and the short-run aggregate supply curve in an economy. Based on the figure, if an increase in aggregate demand from AD0 to AD1 is unanticipated, the economy will move from point A to point _____in the short run.Figure-1 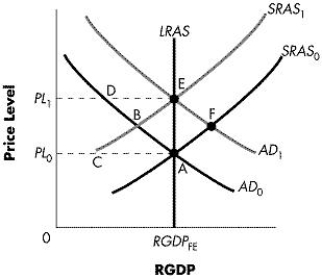
A) A
B) B
C) E
D) F
E) D
Correct Answer:

Verified
Correct Answer:
Verified
Q60: According to the Taylor rule, if real
Q61: A negative supply shock may lead to:<br>A)an
Q62: The rational expectations theory suggests that government
Q63: When expansionary policy is anticipated, it leads
Q64: According to the Taylor rule, the Fed
Q66: Critics of inflation targeting argue that _.<br>A)it
Q67: Starting from a position of macroeconomic equilibrium
Q68: It is difficult for policy makers to
Q69: The crowding-out effect implies that an increase
Q70: A problem associated with targeting inflation at