Multiple Choice
Use the following to answer questions : 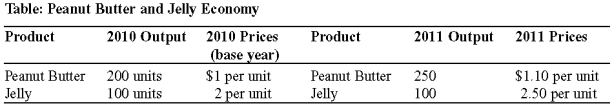
-(Table: Peanut Butter and Jelly Economy) Look at the table Peanut Butter and Jelly Economy. Between 2010 and 2011, nominal GDP:
A) increased by 12.5%.
B) decreased by 12.5%.
C) increased by 16.67%.
D) increased by 31.25%.
Correct Answer:

Verified
Correct Answer:
Verified
Q74: Consider an economy that produces only DVDs
Q98: In the circular-flow diagram, households:<br>A) supply goods.<br>B)
Q140: Real GDP tends to understate our economic
Q179: The circular-flow diagram illustrates:<br>A) the minimum wage
Q244: Use the following to answer questions :<br>Table:
Q246: Use the following to answer questions :<br>Figure:
Q247: Use the following to answer questions :<br>Table:
Q248: Which of the following transactions is included
Q250: Use the following to answer questions:<br>Table: Real
Q251: The scale most often used to compare