Multiple Choice
Use the following to answer questions :
Table: Pizza Economy III
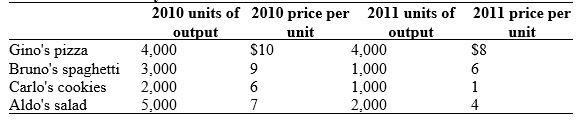
-(Table: Pizza Economy III) Look at the table Pizza Economy III. Considering 2010 as the base year, given that total population was 1,140 in 2010 and 1,380 in 2011, real GDP per capita between 2010 and 2011 grew at a rate of:
A) -50%.
B) -25%.
C) 50%.
D) 75%.
Correct Answer:

Verified
Correct Answer:
Verified
Q78: In the circular-flow diagram, households:<br>A) supply goods.<br>B)
Q189: Gross domestic product is the economy's total
Q355: A firm is an organization that buys
Q356: If the price index in year 1
Q358: In the circular-flow diagram, government purchases of
Q359: The instrument by which a household makes
Q361: When a firm buys a new machine
Q362: Explain the difference between the consumer price
Q363: The GDP deflator measures changes in the
Q364: Use the following to answer questions :<br>Figure: