Multiple Choice
Use the following to answer questions :
Table: Price and Output Data 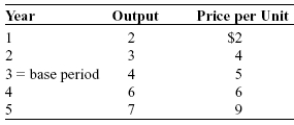
-(Table: Price and Output Data) Look at the table Price and Output Data. Between years 2 and 3, real GDP increased by:
A) 10%.
B) 20%.
C) 30%.
D) 33%.
Correct Answer:

Verified
Correct Answer:
Verified
Related Questions
Q114: Included in GDP is the dollar value
Q162: Domestically produced goods and services sold to
Q187: Real GDP is the same as _
Q314: Use the following to answer questions:<br>Scenario: Real
Q315: Use the following to answer questions :<br>Table:
Q317: Use the following to answer questions:<br>Figure: Expanded
Q320: Overcounting in the GDP can be avoided
Q321: Renting a car to go on a
Q323: Wages are:<br>A)the income households earn by selling
Q324: A household is a person or group