Multiple Choice
Use the following to answer questions :
Table: Price and Output Data 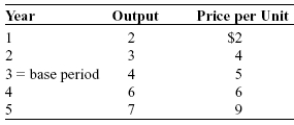
-(Table: Price and Output Data) Look at the table Price and Output Data. Between years 2 and 3 the amount of change in nominal GDP due to inflation was:
A) 100%.
B) 34%.
C) 22%.
D) 5%.
Correct Answer:

Verified
Correct Answer:
Verified
Q1: Aggregate output is the total quantity of
Q2: Which of the following would NOT be
Q3: Use the following to answer questions :<br>Figure:
Q4: Assume that the consumer price index for
Q5: Households supply goods and services in the
Q7: Flows into financial markets are equal to
Q8: If nominal GDP increases from one year
Q9: GDP calculated via factor payments includes:<br>A)wages, interest
Q10: Income tax brackets are indexed to the
Q11: Use the following to answer questions :<br>Figure: