Multiple Choice
Use the following to answer questions :
Figure: Production Possibilities and Circular-Flow Diagram 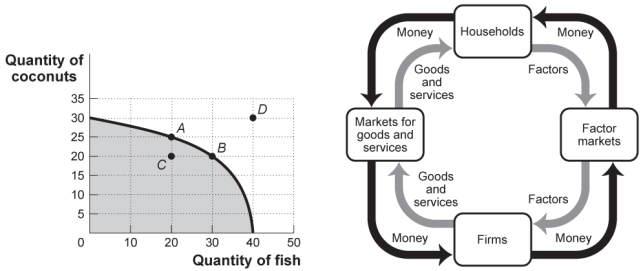
-(Figure: Production Possibilities and Circular-Flow Diagram) Look at the figure Production Possibilities and Circular-Flow Diagram. Assume the two figures represent the same economy. Suppose that in the circular-flow diagram most firms undergo a significant increase in productivity. This results in a significant increase in the output of both coconuts and fish. If all other variables remain unchanged, then the adjustment in this economy would be best represented in the production possibilities figure by a movement from point A toward:
A) point A (no movement) .
B) point B (a decrease in coconut production and an increase in fish production) .
C) point C (a decrease in coconut production) .
D) point D (an outward shift of the entire curve) .
Correct Answer:

Verified
Correct Answer:
Verified
Q30: In the factor market,firms buy resources.
Q53: In building models,economists avoid making any assumptions
Q92: The production possibility frontier is bowed out
Q100: The _ illustrates the trade-offs facing an
Q122: Which of the following statements is TRUE?<br>A)Some
Q123: Greta starts using a new baking technique,
Q125: All points inside the production possibility frontier
Q128: Use the following to answer questions:<br>Figure: Consumer
Q131: Use the following to answer questions:<br>Figure: Tom's
Q281: Roommates Sarah and Zoe are hosting a