Multiple Choice
Use the following to answer question
Figure: Interpreting Aggregate Shifts 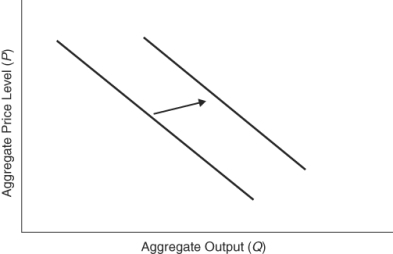
-(Figure: Interpreting Aggregate Shifts) The graph shows:
A) a decrease in aggregate quantity supplied.
B) an increase in aggregate quantity supplied.
C) a decrease in aggregate demand.
D) an increase in aggregate demand.
Correct Answer:

Verified
Correct Answer:
Verified
Q59: Describe demand-pull inflation if the economy begins
Q67: Ceteris paribis,a decrease in imports will increase
Q69: (Figure: Determining SRAS Shifts) <img src="https://d2lvgg3v3hfg70.cloudfront.net/TB3259/.jpg" alt="(Figure:
Q77: In the Keynesian model, the price level
Q112: According to the wealth effect, as prices
Q142: When aggregate prices rise, U.S. goods become
Q207: Which of the following will shift the
Q214: In the short run, a decrease in
Q226: If businesses expect to start earning more
Q242: Short-run macroeconomic equilibrium occurs at the intersection