Multiple Choice
(Figure: Determining Curves) 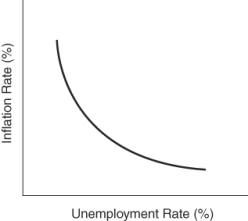 The curve on the graph is a:
A) demand curve.
B) Phillips curve.
C) labor demand curve.
D) production possibilities curve.
Correct Answer:

Verified
Correct Answer:
Verified
Related Questions
Q30: According to the equation for the Phillips
Q56: The 2007-2009 recession was caused by:<br>A) an
Q109: If policymakers attempt to reduce the rate
Q111: The original Phillips curve shows the relationship
Q121: Credit default swaps<br>A) are a type of
Q133: Social Security payments rise according to the
Q158: What caused the housing boom of 2003
Q195: Collateralized debt obligations:<br>A) are mortgages whose interest
Q215: In effect, the Phillips curve framework implies
Q260: As inflationary expectations rise, the _ Phillips