Multiple Choice
(Figure: Understanding Economic Shifts) 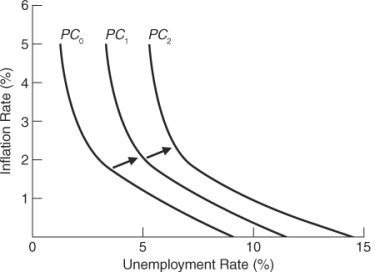 The graph depicts:
A) an expansion.
B) dropping unemployment rates.
C) stagflation.
D) deflation.
Correct Answer:

Verified
Correct Answer:
Verified
Related Questions
Q130: The long-run Phillips curve<br>A) shows a tradeoff
Q169: As inflation rises, the real value of
Q174: Stagflation is the simultaneous occurrence of both
Q200: Adjustable-rate mortgages:<br>A) are mortgages whose interest rates
Q203: Which of the following is NOT a
Q204: Cite three factors that contributed to the
Q206: Which of the following did President Reagan
Q207: During the early 1970s,the Phillips curve:<br>A) shifted
Q209: Which of the following actions was NOT
Q210: The contractionary policies of the Fed under