True/False
Use the following to answer question
Figure: Graph Interpretation 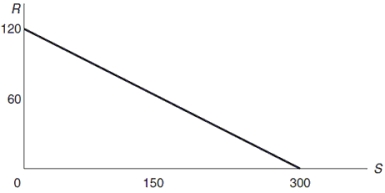
-(Figure: Graph Interpretation)In the graph,a negative relationship is depicted with a slope of -0.4.
Correct Answer:

Verified
Correct Answer:
Verified
Related Questions
Q33: Which of the following represents incentives for
Q34: "How do interest rates influence employment?" is
Q42: The broad scope of economics analysis allows
Q71: Hitting your snooze alarm before you get
Q73: The government can always successfully intervene if
Q139: Economics is about allocating limited resources to
Q177: Economists understand that people respond to<br>A) laws.<br>B)
Q188: Linear relationships show the same slope between
Q233: Private markets will typically maximize production efficiency
Q236: Economists generally have _ to say about