Multiple Choice
Figure: Price Changes 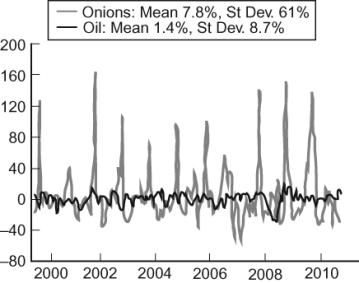 The figure (from Global Financial Data, EIA) illustrates in percentage terms how the price of onions (in gray) and crude oil (in black) fluctuate over time. The price of onions clearly fluctuates more than oil. In 1958, the United States Congress banned future markets on onions. How does this historical fact explain the difference in deviation between oil and onions?
A) The ban prevented analysts from buying and selling based on the price of onions' current supply and demand.
B) The ban encouraged speculation on the onion, causing its price to fluctuate widely as different bubbles grew and popped.
C) The ban destroyed any incentive for market participants to understand the onion industry.
D) The ban forced market participants to buy and sell based solely on current supply and demand.
Correct Answer:

Verified
Correct Answer:
Verified
Q77: The central planning approach fails to achieve
Q78: Which scenario shows a relatively noisy signal
Q79: Speculators often raise prices today but lower
Q80: Use the following to answer questions:<br>Figure: Hollywood
Q81: When oil prices increased in the 1970s,
Q83: Futures markets largely _ risk.<br>A) do not
Q84: Central planning of resource allocation:<br>A) was attempted
Q85: If an increase in oil prices made
Q86: Failing to understand the signaling role of
Q87: Markets are linked in unpredictable and creative