Multiple Choice
Figure: Demand 1 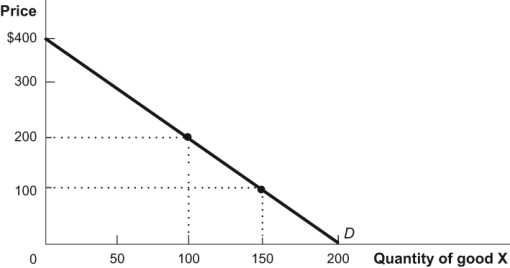 In the diagram, what is the elasticity of demand between a price of $100 and $200? Use the midpoint method of calculation to find your answer.
A) -1.8.
B) -0.9.
C) -0.6.
D) -0.2.
Correct Answer:

Verified
Correct Answer:
Verified
Related Questions
Q184: In an effort to decrease carbon emissions
Q185: The price of good X increases from
Q186: Use the following to answer questions:<br>Figure: Slave
Q187: Elasticity of demand is always negative.
Q188: Because of aging requirements it takes many
Q190: Gun buyback programs, such as the one
Q191: The elasticity of demand for cigarettes is
Q192: If the price of music CDs increases
Q193: Which one of the following products would
Q194: In 2005, Ireland began taxing residents on