Multiple Choice
Use the following to answer questions:
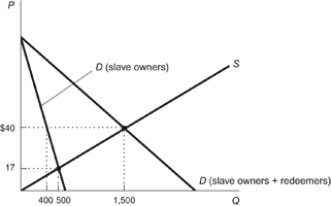
Figure: Slave Redemption 
-(Figure: Slave Redemption) Refer to the figure. Assume the graph illustrates the Sudanese slave trade. When slave redeemers enter the market, the price of slaves:
A) increases to $40.
B) decreases to $17.
C) stays unchanged at $40.
D) exceeds $40.
Correct Answer:

Verified
Correct Answer:
Verified
Q25: The elasticity of supply measures how sensitive
Q26: The demand for oil would become less
Q27: In Medieval Europe, there were two basic
Q28: In which situation would you expect supply
Q29: If the price of Good Y falls
Q31: The flatter the demand curve, the less
Q32: Suppose that along a given demand curve,
Q33: Economists categorize price elasticity of demand greater
Q34: Similar to the elasticity of demand, the
Q35: When price increases and demand is elastic,