Multiple Choice
Figure: Supply and Demand 1 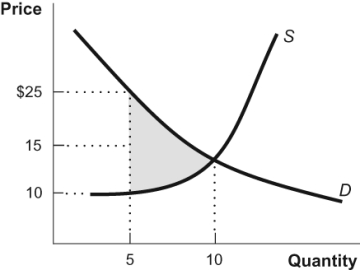 At a market quantity of 5, the shaded region in the figure represents:
A) satisfied wants.
B) unexploited gains from trade.
C) the value of wasted resources.
D) willingness to pay.
Correct Answer:

Verified
Correct Answer:
Verified
Related Questions
Q96: Figure: Four Panel 1 <img src="https://d2lvgg3v3hfg70.cloudfront.net/TB3377/.jpg" alt="Figure:
Q97: When there is a recession, the price
Q98: The government must subsidize firms to ensure
Q99: A market surplus can be defined as
Q100: Which of the following would cause the
Q102: If market demand decreases:<br>A) equilibrium price and
Q103: An increase in demand causes an increase
Q104: In free markets, shortages lead to:<br>A) lower
Q105: Gains from trade are maximized in a
Q106: Suppose the price of oil is falling