Multiple Choice
Figure: Supply-Driven Price Change 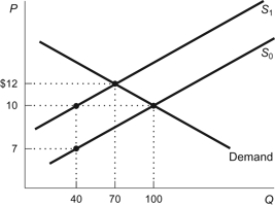 Refer to the figure. When the supply curve shifts from S0 to S1, the equilibrium price rises to:
A) $12 and the equilibrium quantity falls to 70.
B) $10 and the equilibrium quantity falls to 100.
C) $12 and the equilibrium quantity falls to 40.
D) $10 and the equilibrium quantity falls to 70.
Correct Answer:

Verified
Correct Answer:
Verified
Q10: Surpluses drive price up, while shortages drive
Q149: A decrease in the supply of milk
Q150: The equilibrium price is unstable because sellers
Q151: If supply decreases and its slope remains
Q152: The price of gasoline decreased dramatically in
Q155: In free markets, surpluses lead to:<br>A) lower
Q156: If the market price is above the
Q157: Gains from trade are maximized at the:<br>A)
Q158: When the quantity supplied of a good
Q159: Imagine a free market in which quantity