Multiple Choice
Figure: Supply and Demand 2 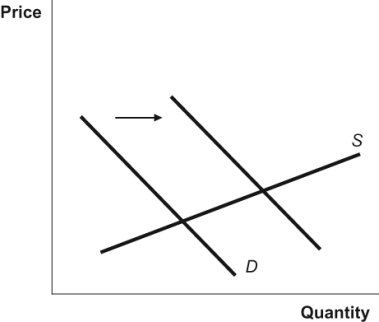 What happens as a result of the change in demand in the diagram?
A) a decrease in both the equilibrium price and the equilibrium quantity
B) an increase in both the equilibrium price and the equilibrium quantity
C) an increase in the equilibrium price and a decrease in the equilibrium quantity
D) a decrease in the equilibrium price and an increase in the equilibrium quantity
Correct Answer:

Verified
Correct Answer:
Verified
Q3: Higher gasoline prices have led to a
Q5: An increase in the wages of fruit
Q6: A free market can be described by
Q7: An increase in supply and a decrease
Q9: Table: Supply and Demand Schedule<br><img src="https://d2lvgg3v3hfg70.cloudfront.net/TB3377/.jpg" alt="Table:
Q10: If the market for iPads experiences a
Q11: In the long run, will the market
Q12: The government plans to increase cigarette taxes
Q13: Use the following to answer questions:<br>Figure: Chocolate
Q19: An early frost in the vineyards of