Multiple Choice
Figure: Demand Shift 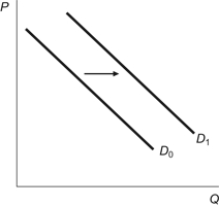 Which of the following could explain the figure?
A) Consumer income increases in the market for a normal good.
B) Consumer income falls in the market for a normal good.
C) Consumer income rises in the market for an inferior good.
D) Consumer income remains the same and the price of the good falls.
Correct Answer:

Verified
Correct Answer:
Verified
Q193: An increase in a per unit production
Q194: An increase in demand shifts the demand
Q195: The demand curve for an inferior good
Q196: A decrease in expected future supply of
Q197: Nigeria receives $53 of producer surplus from
Q199: An increase in supply refers to:<br>A) a
Q200: There is no relationship between present prices
Q201: One result of the North American Free
Q202: A change in quantity supplied is reflected
Q203: The difference between the market price and