Multiple Choice
Figure: A Supply Curve 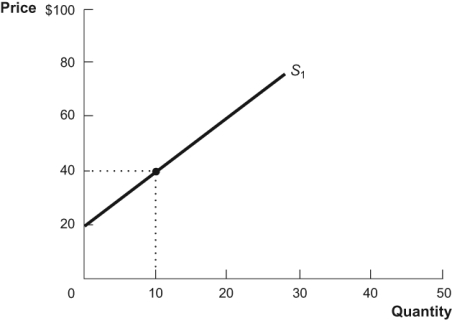 Refer to the figure. Producer surplus at a price of $40 is:
A) $200.
B) $100.
C) $400.
D) $600.
Correct Answer:

Verified
Correct Answer:
Verified
Related Questions
Q203: The difference between the market price and
Q204: If producers expect the price of a
Q205: Explain the difference between a change in
Q206: There are more substitutes for oil as
Q207: Throughout 2005, average home prices in the
Q209: Which of the following statements about the
Q210: The quantity demanded is the quantity that
Q211: As the price of a good increases:<br>A)
Q212: The quantity demanded is the quantity that
Q213: Other things being equal, total consumer surplus