Multiple Choice
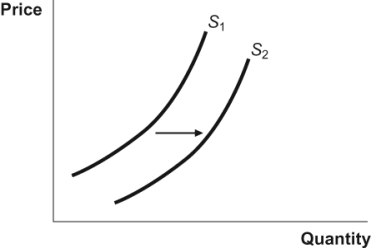
Figure: Supply Shift  In the figure, a movement from S1 to S2 represents:
A) a decrease in supply.
B) an increase in supply.
C) a decrease in quantity supplied.
D) an increase in quantity supplied.
Correct Answer:

Verified
Correct Answer:
Verified
Q224: Figure: Demand Curve <img src="https://d2lvgg3v3hfg70.cloudfront.net/TB3377/.jpg" alt="Figure: Demand
Q225: Figure: Supply Shift <img src="https://d2lvgg3v3hfg70.cloudfront.net/TB3377/.jpg" alt="Figure: Supply
Q226: Figure: Demand Curve <img src="https://d2lvgg3v3hfg70.cloudfront.net/TB3377/.jpg" alt="Figure: Demand
Q227: Figure: Religion <img src="https://d2lvgg3v3hfg70.cloudfront.net/TB3377/.jpg" alt="Figure: Religion
Q228: Which of the following choices correctly illustrates
Q230: Suppose that Saudi Arabia can produce oil
Q231: If the price of granite countertops rises,
Q232: Which of the following factors causes a
Q233: For a normal good, higher income results
Q234: Which of the following would cause the