Multiple Choice
Use the following to answer questions:
Figure: Supply Shift 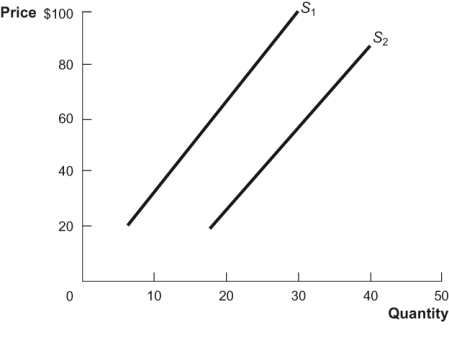
-(Figure: Supply Shift) What would cause the supply curve to shift from S2 to S1 as shown in the diagram?
A) a decrease in the opportunity costs of producing the good
B) a decrease in the costs of production
C) an increase in the prices of inputs used in production
D) an expected decrease in the future price of the good
Correct Answer:

Verified
Correct Answer:
Verified
Q10: An inferior good is one of poor
Q11: A decrease in income causes demand for
Q12: A supply and/or demand graph typically shows:<br>A)
Q13: The quantity supplied:<br>A) shows how much buyers
Q14: The supply curve for oil slopes upward
Q16: A market has a demand equation as
Q17: Peoples' expectation of the price of gasoline
Q18: Which of the following is TRUE about
Q19: Which of the following statements is TRUE?<br>A)
Q20: Mark considers 3-D archery and shooting trap