Multiple Choice
Use the following to answer questions:
Figure: Supply Shift 2 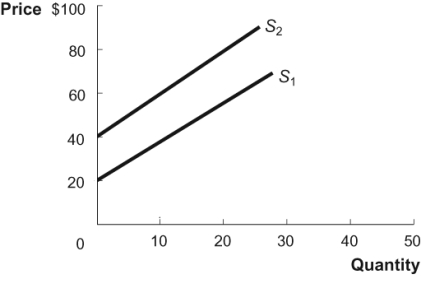
-(Figure: Supply Shift 2) Refer to the figure. What would cause the supply curve to shift from S1 to S2?
A) a $20 tax reduction on each unit of output
B) a $40 tax reduction on each unit of output
C) a $40 subsidy reduction on each unit of output
D) a $20 subsidy reduction on each unit of output
Correct Answer:

Verified
Correct Answer:
Verified
Q128: A vertical reading of the demand curve
Q129: The supply curve tells us the minimum
Q130: The most important concepts in economics, according
Q131: At low prices, only low-cost producers serve
Q132: A technological innovation in the production of
Q134: Suppose that consumers begin to believe that
Q135: Quantity demanded:<br>A) shows how much buyers are
Q136: Figure: Demand Curve <img src="https://d2lvgg3v3hfg70.cloudfront.net/TB3377/.jpg" alt="Figure: Demand
Q137: A good is considered normal if demand
Q138: The demand curve has a negative slope.