Multiple Choice
Use the following to answer questions:
Figure: Supply Shift 2 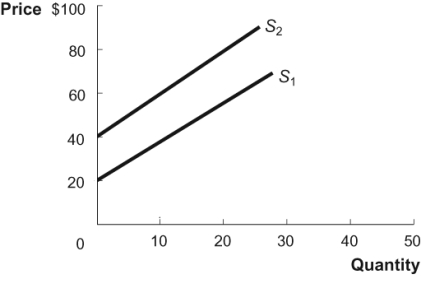
-(Figure: Supply Shift 2) Refer to the figure. What would cause the supply curve to shift from S1 to S2?
A) a $20 tax on each unit of output
B) a $40 tax on each unit of output
C) a $40 subsidy on each unit of output
D) a $20 subsidy on each unit of output
Correct Answer:

Verified
Correct Answer:
Verified
Q98: The demand curve for oil shows:<br>A) the
Q99: An inferior good is one that:<br>A) is
Q100: If the price of _ rises, all
Q101: An increase in demand is a movement
Q102: Firms are willing and able to sell
Q104: Scientists discover that an asteroid is headed
Q105: Figure: Oil Market <img src="https://d2lvgg3v3hfg70.cloudfront.net/TB3377/.jpg" alt="Figure: Oil
Q106: Joe runs a landscape company and uses
Q107: Figure: Demand <img src="https://d2lvgg3v3hfg70.cloudfront.net/TB3377/.jpg" alt="Figure: Demand
Q108: Which variable does NOT shift the demand