Multiple Choice
Figure: Leisure 2 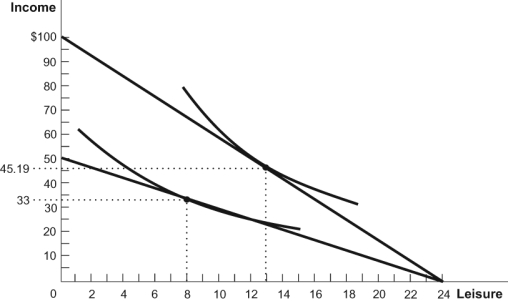 Refer to the figure. According to this diagram, which statement is FALSE?
A) At 13 hours of leisure and an income of $45.19, the worker earns a wage of $4.17 an hour.
B) The labor supply curve is downward sloping.
C) The substitution effect dominates the income effect.
D) This worker chooses to work more hours if paid higher wages.
Correct Answer:

Verified
Correct Answer:
Verified
Q1: The utility-maximizing consumption bundle for a consumer
Q2: Use the following to answer questions:<br>Figure: Comic
Q4: Everyone should shop at _ because they
Q6: The opportunity cost of income is typically
Q7: After purchasing and then losing a ticket
Q8: Use the following to answer questions:<br>Figure: Leisure
Q9: Use the following to answer questions:<br>Figure: Music
Q10: Use the following to answer questions:<br>Figure: Budget
Q11: Consider an indifference curve based around video
Q65: If the price of good X is