Multiple Choice
Figure: Risk 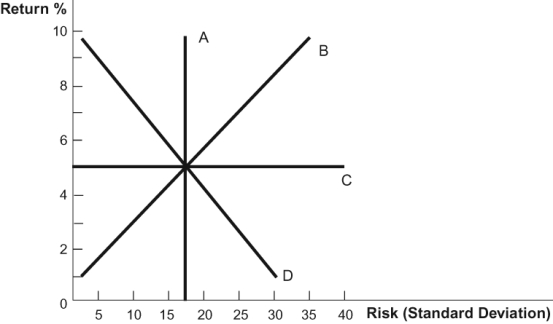 Refer to the figure. Which curve in the diagram correctly identifies the relationship between risk and return?
A) A
B) B
C) C
D) D
Correct Answer:

Verified
Correct Answer:
Verified
Related Questions
Q112: When a stock index rises, it means
Q113: The riskiest stocks are those that have
Q114: According to the rule of 70, if
Q115: Some skeptical economists say that successful brokers
Q116: Which is helpful in stock investment strategies?<br>A)
Q118: Someone who purchased stock in_ seems to
Q119: Compared to stocks, art investments have _
Q120: Which of the following is TRUE of
Q121: Which is NOT a major stock index?<br>A)
Q122: "Buy and hold" involves buying stocks and