Essay
Mrs. Crabapple has a class with three students, and she has had four quizzes so far this semester. She has created control charts to determine if the variation in students' scores from quiz to quiz is exhibiting only natural variation. Each of the quiz scores is shown below. The upper and lower control limits for the x chart are 109.6 and 34.9, respectively. The upper and lower control limits for the R chart are 93.95 and 0, respectively.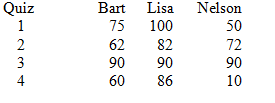
Is the process in a state of control?
Correct Answer:

Verified
Yes (X-Bar = ∑scores/n Bart = (75+62+90+...View Answer
Unlock this answer now
Get Access to more Verified Answers free of charge
Correct Answer:
Verified
View Answer
Unlock this answer now
Get Access to more Verified Answers free of charge
Q21: Consider a p-chart measuring the percentage of
Q33: A p-chart is an example of what?<br>A)
Q34: Product specifications are preset, whereas control limits
Q44: A skewed distribution implies that assignable causes
Q45: Suppose that you want to monitor the
Q56: A process can be considered in a
Q85: What is the formula for an x-bar
Q124: What is a c-chart?
Q128: What is the relationship between C<sub>p</sub><sub> </sub>and
Q132: Six sigma programs strive to set control