Multiple Choice
Given the following graphs, which graph represents fixed costs? 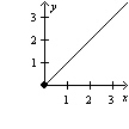
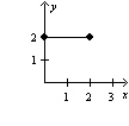
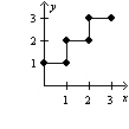

A) II
B) I
C) III
D) none of these
Correct Answer:

Verified
Correct Answer:
Verified
Related Questions
Q11: _ are costs incurred that provide long-term
Q66: _ are those that are acquired from
Q91: Innova, Inc., is beginning the production of
Q92: Figure 3-4 The following information is available
Q94: Figure 3-7 The following computer printout estimated
Q95: The following information was available about supplies
Q97: Cost behavior analysis focuses on how costs<br>A)
Q98: Flexible resources<br>A) are supplied as needed.<br>B) are
Q99: Holly Corporation has the following costs for
Q100: Figure 3-8 The following computer printout estimated