Multiple Choice
The diagram below is a: 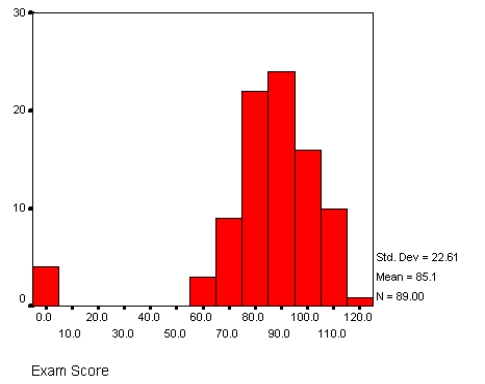
A) Mean
B) Mode
C) Bar chart
D) Frequency polygon
E) Histogram
Correct Answer:

Verified
Correct Answer:
Verified
Related Questions
Q46: How can statistics be unethically manipulated? Outline
Q48: Use the following to answer questions 16-18:<br>In
Q49: Which of the following data displays would
Q50: In the following distribution of the variable
Q51: Descriptive statistics estimate the degree of confidence
Q52: Describe circumstances in which mean, median, and
Q54: Measures of central tendency assess the extent
Q55: Elaboration analysis demonstrations the distribution of variables
Q57: Using the table below, explain the hypothesis
Q58: A normal distribution is generally bell-shaped.