Multiple Choice
The diagram below is a 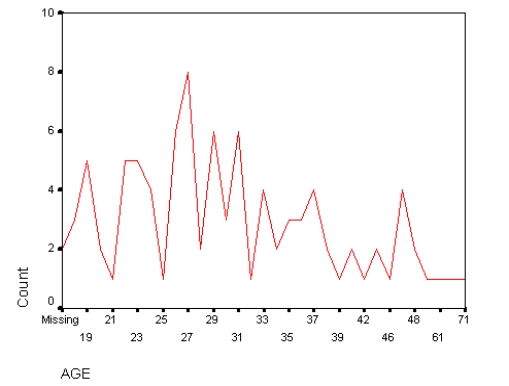
A) Mean
B) Mode
C) Bar chart
D) Frequency polygon
E) Histogram
Correct Answer:

Verified
Correct Answer:
Verified
Related Questions
Q26: The process of checking data for errors
Q27: In the following distribution of the variable
Q28: Standard deviation is defined as the square
Q29: What is the purpose of using statistics
Q30: Means are affected by skewness, while medians
Q32: In the following distribution of the variable
Q33: When a researcher has a distribution in
Q34: What does statistical significance mean with regard
Q35: A frequency polygon contains solid bars separated
Q36: The process of checking data carefully for