Multiple Choice
Refer to the following graph for the questions. 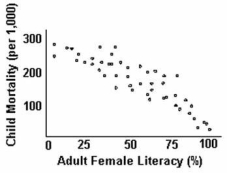
-The graph indicates that more children die
A) in the last stage of the demographic transition.
B) in the first stage of the demographic transition.
C) when their mothers are illiterate.
D) when their mothers are literate.
E) when their mothers are poor.
Correct Answer:

Verified
Correct Answer:
Verified
Q2: Historically,up until the Middle Ages,populations were mostly
Q3: The world human population reached 1 billion
Q4: Which of the following is a pronatalist
Q5: Use the following demographic data on
Q6: Family planning means enabling people to<br>A)have fewer
Q8: The doubling time for a population with
Q9: The doubling time for the population of
Q10: Economist Julian Simon believed that people are
Q11: The number of children born to an
Q12: A population growing at 1% per year