Multiple Choice
Which graph shows data that are more suitable for regression analysis? 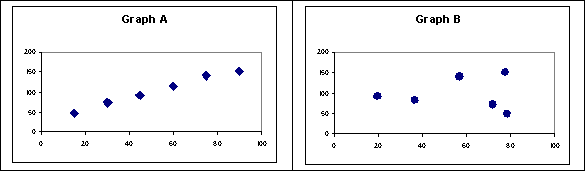
A) Graph A
B) Graph B
C) Neither Graph A nor Graph B
D) Cannot be determined
Correct Answer:

Verified
Correct Answer:
Verified
Related Questions
Q10: The trend line from a scatter plot
Q32: A firm has the capacity to produce
Q38: If we want to estimate the cost
Q49: Explain how scatter plots are used in
Q49: Which of the following is not an
Q50: List the assumptions made when a linear
Q55: List one assumption made when a linear
Q86: The relevant range is defined as:<br>A) The
Q109: In a regression equation, variable costs are
Q112: Regression analysis works best when the relationship