Multiple Choice
A technical writer wants to create a graphic showing the proportion of hurricanes that have hit each of the Gulf Coast states between 1900 and 2005. The graphic will be included in a safety brochure to be distributed to the public by the Federal Emergency Management Agency. Which graphic best displays these data?
A) 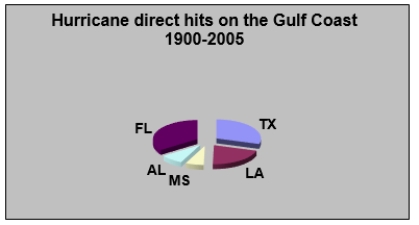
B) 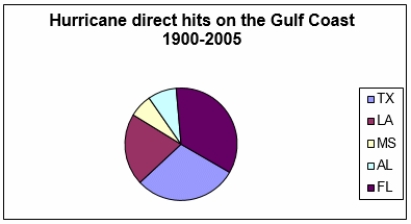
C) 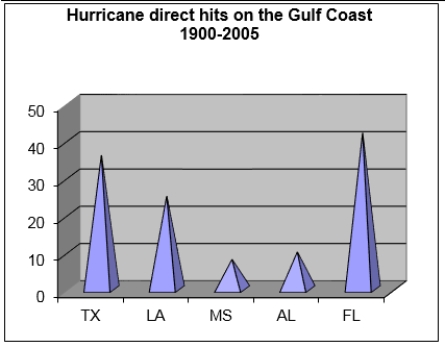
D) 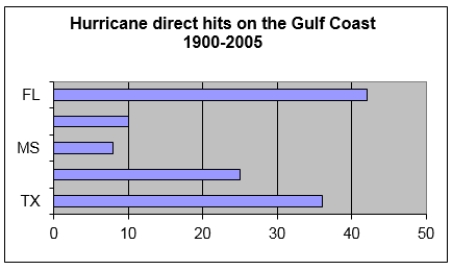
Correct Answer:

Verified
Correct Answer:
Verified
Q1: A screen shot is a graphic showing
Q2: In a table, the stub is the
Q8: If you want to publish a graphic
Q22: What does copyright law have to do
Q23: Which of these graphics would be most
Q24: Which of the following graphics would be
Q25: Chapter 8 provides seven guidelines for creating
Q28: Chapter 8 offers six principles for using
Q30: graphics are important in technical communication because
Q34: one potential drawback of photographs is that