Multiple Choice
A technical writer wants to create a graphic showing the proportion of hurricanes that have hit each of the Gulf Coast states between 1900 and 2005. The graphic will be included in a safety brochure to be distributed to the public by the Federal Emergency Management Agency. Which graphic best displays these data?
A) 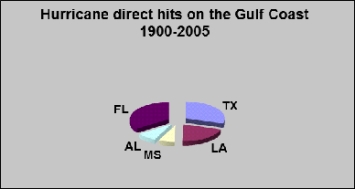
B) 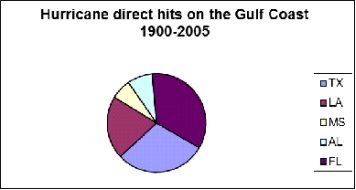
C) 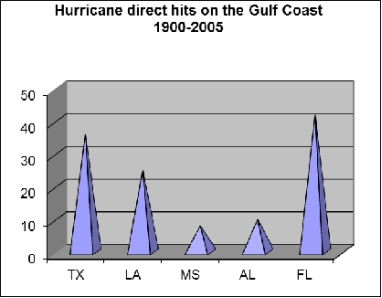
D) 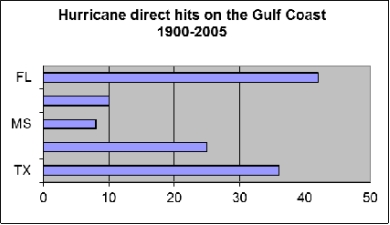
Correct Answer:

Verified
Correct Answer:
Verified
Q2: In a table, the stub is the
Q4: Chapter 12 discusses five characteristics that make
Q12: Chapter 12 suggests that you consider four
Q14: Chapter 12 offers six guidelines for using
Q18: graphics are important in technical communication because
Q19: To achieve the most effective contrast between
Q20: Chapter 12 discusses five principles for making
Q24: Which of the following graphics would be
Q36: Which of the following graphics would be
Q39: Many Western hand gestures, such as the