Multiple Choice
A technical writer wants to create a graphic showing the proportion of hurricanes that have hit each of the Gulf Coast states between 1900 and 2005. The graphic will be included in a safety brochure to be distributed to the public by the Federal Emergency Management Agency. Which graphic best displays these data?
A) 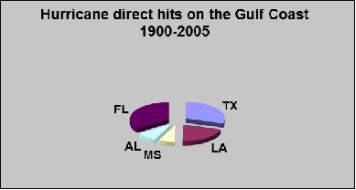
B) 
C) 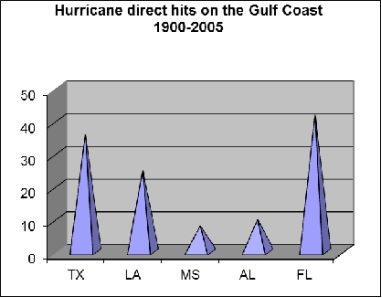
D) 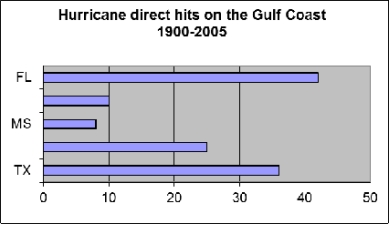
Correct Answer:

Verified
Correct Answer:
Verified
Q1: A screen shot is a graphic showing
Q2: A writing team has the six-month sales
Q3: why do you need to cite the
Q3: Chapter 12 identifies four stages in the
Q7: Which type of graphic does NOT use
Q20: Chapter 12 discusses five principles for making
Q24: A writer is creating a table that
Q26: Saving space is not an ideal reason
Q36: one way to create graphics is to
Q37: Graphics typically increase the costs of translating