Multiple Choice
Use the following to answer questions: 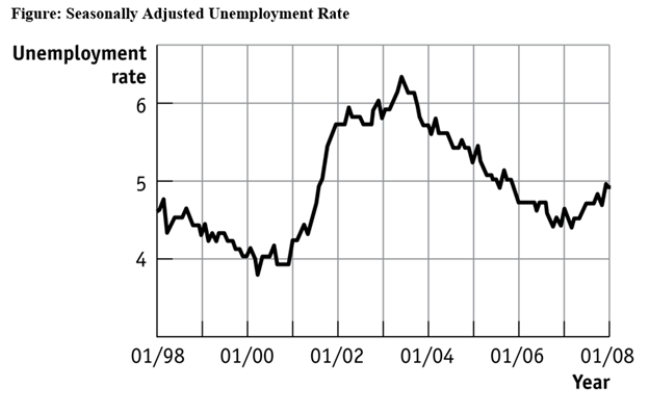
-(Figure: Seasonally Adjusted Unemployment Rate) Use Figure: Seasonally Adjusted Unemployment Rate.The distance between each labeled point on the horizontal axis is 1 year,and the distance between each labeled point on the vertical axis is 1 percentage point of unemployment.Using this graph,the unemployment rate was at its lowest point (in the time window shown) in _____ and at its highest point (in the time window shown) in _____.
A) 2003;2000
B) 2007;2001
C) 2003;1999
D) 2000;2003
Correct Answer:

Verified
Correct Answer:
Verified
Q6: The point at which the axes of
Q17: The relation between two variables that move
Q21: The fact that two variables always move
Q23: The owner of the Dismal Philosopher,one of
Q24: Use the following to answer questions: <img
Q31: Use the following to answer questions: <img
Q41: Use the following to answer question: <img
Q42: Use the following to answer question: <img
Q43: Use the following to answer question: <img
Q50: A scatter diagram shows:<br>A)how far apart dependent