True/False
Use the following to answer question: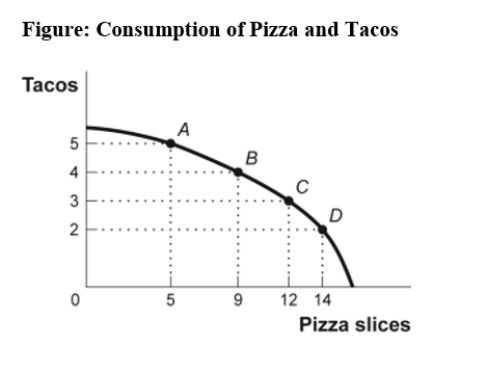
-(Figure: Consumption of Pizza and Tacos)Use Figure: Consumption of Pizza and Tacos.The figure shows the number of tacos and pizza slices Matt can eat in a day.The best estimate of the slope between point A and point B is -4.
Correct Answer:

Verified
Correct Answer:
Verified
Related Questions
Q50: A scatter diagram shows:<br>A)how far apart dependent
Q51: If two variables are positively related:<br>A)as one
Q52: Use the following to answer question: <img
Q53: Use the following to answer question: <img
Q54: Use the following to answer question: <img
Q55: Use the following to answer question: <img
Q56: Taylor sees a bar graph showing the
Q58: Your boss asks you to graph company
Q59: In looking at a chart of the
Q60: Use the following to answer question: <img