Multiple Choice
Use the following to answer questions: 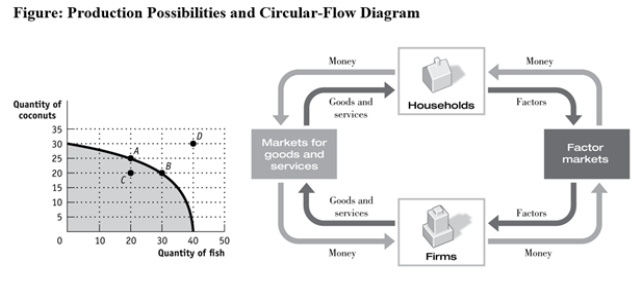
-(Figure: Production Possibilities and Circular-Flow Diagram) Use Figure: Production Possibilities and Circular-Flow Diagram.Assume the two figures represent the same economy.Suppose that in the circular-flow diagram there is a significant decrease in the amount of labour flowing to the firms that produce coconuts.If all other variables remain unchanged,this adjustment in the economy would be BEST represented in the production possibilities figure by a move from point A toward:
A) point A (no movement) .
B) point B (a decrease in coconut production and an increase in fish production) .
C) point C (a decrease in coconut production) .
D) point D (an outward shift of the entire curve) .
Correct Answer:

Verified
Correct Answer:
Verified
Q3: Because Casey can type reports faster and
Q40: Use the following to answer question:<br><img src="https://d2lvgg3v3hfg70.cloudfront.net/TB6643/.jpg"
Q44: Suppose Poland is producing on its production
Q61: Use the following to answer question:<br><img src="https://d2lvgg3v3hfg70.cloudfront.net/TB6643/.jpg"
Q166: Use the following to answer question:<br><img src="https://d2lvgg3v3hfg70.cloudfront.net/TB6643/.jpg"
Q259: Use the following to answer questions: <img
Q259: Use the following to answer question: <img
Q260: The financial crisis of 2008-2009:<br>A) was accurately
Q266: Use the following to answer questions:<br>Figure: Strawberries
Q267: In terms of the production possibility frontier,the